P&O Cruises
Cruise line · ships, cruises and homeports
P&O Cruises sails 7 ships from 12 homeports to 184 ports. Most cruises are 6–8 nights, mostly in the Western Europe, Azores, Canary Islands.
- ShipsShips in service
- 7
- CruisesCruises · 12 mo
- 249
- Homeports
- 12
- PortsPorts visited
- 184
- next 12 months
- Avg ship ageAverage ship age
- 15 yrs
The P&O Cruises fleet
7 ships in service
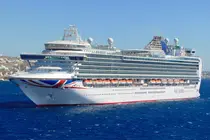
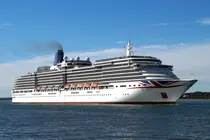
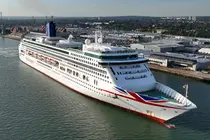
| Photo | Ship | Built | Gross tonnage | Decks | Cabins | Guests | Crew |
|---|---|---|---|---|---|---|---|
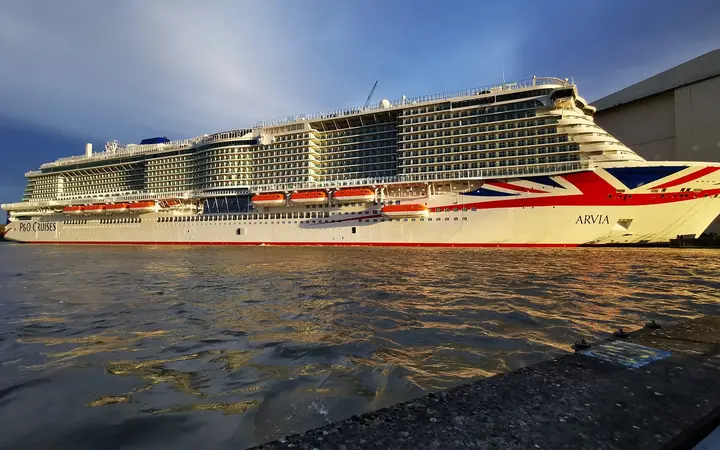
| Arvia Excel class · 2022 · 184,700 GT | 2022 | 184,700 | 19 | 2,614 | 5,206 | 1,762 | |
| Iona Excel class · 2020 · 184,089 GT | 2020 | 184,089 | 20 | 2,614 | 5,200 | 1,762 | |
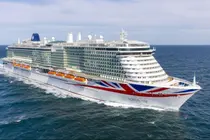
| Britannia Royal class · 2015 · 143,730 GT | 2015 | 143,730 | 18 | 1,837 | 3,647 | 1,350 | |
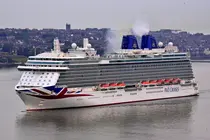
| Ventura Grand class · 2008 · 116,017 GT | 2008 | 116,017 | 18 | 1,553 | 3,106 | 1,226 | |
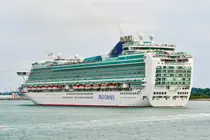
| Azura Grand class · 2010 · 115,055 GT | 2010 | 115,055 | 18 | 1,557 | 3,096 | 1,250 | |
| Arcadia Vista class · 2005 · 84,342 GT | 2005 | 84,342 | 11 | 952 | 1,904 | 866 | |
| Aurora 2000 · 76,152 GT | 2000 | 76,152 | 13 | 941 | 1,882 | 850 |

Where P&O Cruises sails
Ships starting a cruise in each region, by month · Nov 2026 – Oct 2027
Most of the fleet sails in the Western Europe, Azores, Canary Islands: 6 ships at its busiest in Oct and 1 in Sep. P&O Cruises also sails in Baltic, Norwegian Fjords, Russia, Mediterranean and Bahamas, Caribbean, Bermuda, and 5 more regions.
| Region | Nov | Dec | Jan | Feb | Mar | Apr | May | Jun | Jul | Aug | Sep | Oct |
|---|---|---|---|---|---|---|---|---|---|---|---|---|
| Western Europe, Azores, Canary Islands | 4 | 4 | 2 | 3 | 3 | 3 | 4 | 2 | 3 | 3 | 1 | 6 |
| Baltic, Norwegian Fjords, Russia | 2 | 1 | 2 | 4 | 4 | 5 | 5 | 2 | 6 | 5 | 2 | |
| Mediterranean | 1 | 1 | 1 | 2 | 2 | 4 | 3 | 4 | 3 | 2 | ||
| Bahamas, Caribbean, Bermuda | 2 | 2 | 5 | 2 | 2 | 2 | ||||||
| Australia, New Zealand and Pacific Ocean | 1 | 1 | ||||||||||
| Ireland, United Kingdom | 1 | 1 | ||||||||||
| Iceland, Greenland, Faroe Islands | 1 | 1 | ||||||||||
| Africa, Indian Ocean Islands | 1 | |||||||||||
| East Coast USA | 1 |
Ships in region:1–23–56–1516+
A ship counts in a region when a cruise starting that month has most of its port calls there.
How long P&O Cruises cruises are
Share of sailings by length, against other cruise lines in the same region and month · Nov 2026 – Oct 2027
Across all regions, 40% of P&O Cruises sailings are 6–8 nights, against 49% for other cruise lines.
P&O Cruises
249 sailings
Other cruise lines
16,415 sailings
Up to 5 nights6–8 nights9–13 nights14+ nights
| Length | P&O Cruises | Other lines | Difference |
|---|---|---|---|
| Up to 5 nights | 7% · 18 | 22% · 3,597 | −15 pts |
| 6–8 nights | 40% · 100 | 49% · 8,116 | −9 pts |
| 9–13 nights | 18% · 45 | 16% · 2,643 | +2 pts |
| 14+ nights | 35% · 86 | 13% · 2,059 | +22 pts |
Sailings starting in the period. A voyage sold from several embarkation ports is counted once. Region = where most of the sailing’s port calls are. Difference in percentage points.
P&O Cruises capacity
Available passenger cruise days (APCD): lower berths × nights · Nov 2026 – Oct 2027
- APCD · 12 months
- 9.53M
- Share of all capacity
- 2.8%
- of 341.0M APCD on 45 lines
- Rank by capacity
- 11th
- ahead of Disney Cruise Line 6.28M, Viking Ocean 4.96M
- Berths at sea per day
- 26,533
- average
By month
APCD per month · share of all cruise capacity that month below · Nov counts from 7 Nov
Busiest monthOther months
By region
P&O Cruises APCD and its share of all cruise capacity in each region · top 8 regions
| Region | By month | APCD | Share of region |
|---|---|---|---|
| Western Europe, Azores, Canary Islands 15.0% of the region | 2.69M | 15.0% | |
| Bahamas, Caribbean, Bermuda 2.1% of the region | 2.36M | 2.1% | |
| Baltic, Norwegian Fjords, Russia 8.1% of the region | 2.17M | 8.1% | |
| Mediterranean 1.8% of the region | 1.94M | 1.8% | |
| Australia, New Zealand and Pacific Ocean 1.0% of the region | 0.11M | 1.0% | |
| Africa, Indian Ocean Islands 5.7% of the region | 0.09M | 5.7% | |
| Ireland, United Kingdom 1.7% of the region | 0.08M | 1.7% | |
| Iceland, Greenland, Faroe Islands 2.7% of the region | 0.05M | 2.7% |
Berths = guests at double occupancy. Each ship-night is counted once, even when the voyage is sold from several ports, in the month it falls in. A sailing’s nights count in the region where most of its port calls are. All capacity = the cruise lines CruiseDig tracks, not the whole industry.
Where P&O Cruises cruises start
Top 10 of 12 homeports by departures in the next 12 months
| Homeport | Departures | Ships | Plan your departure |
|---|---|---|---|
| Southampton United Kingdom · 6 ships | 163 | 6 | ParkingHotelsGetting there |
| Valletta Malta · 1 ship | 30 | 1 | ParkingHotelsGetting there |
| Bridgetown Barbados · 2 ships | 20 | 2 | ParkingHotelsGetting there |
| Santa Cruz de Tenerife Spain · 1 ship | 19 | 1 | ParkingHotelsGetting there |
| St John's Antigua and Barbuda · 2 ships | 10 | 2 | ParkingHotelsGetting there |
| Brisbane Australia · 1 ship | 1 | 1 | ParkingHotelsGetting there |
| Cape Town South Africa · 1 ship | 1 | 1 | ParkingHotelsGetting there |
| Hong Kong China · 1 ship | 1 | 1 | ParkingHotelsGetting there |
| Málaga Spain · 1 ship | 1 | 1 | ParkingHotelsGetting there |
| San Francisco United States · 1 ship | 1 | 1 | ParkingHotelsGetting there |
Top ports of call
Calls in the next 12 months · 181 ports
- 1FunchalPortugal54
- 2ArrecifeSpain45
- 3HaugesundNorway45
- 4StavangerNorway44
- 5OldenNorway43
- 6CádizSpain41
- 7A CoruñaSpain40
- 8Las Palmas de Gran CanariaSpain40
- 9Santa Cruz de TenerifeSpain40
- 10LisbonPortugal35
- 11PhilipsburgSint Maarten31
- 12St George'sGrenada30