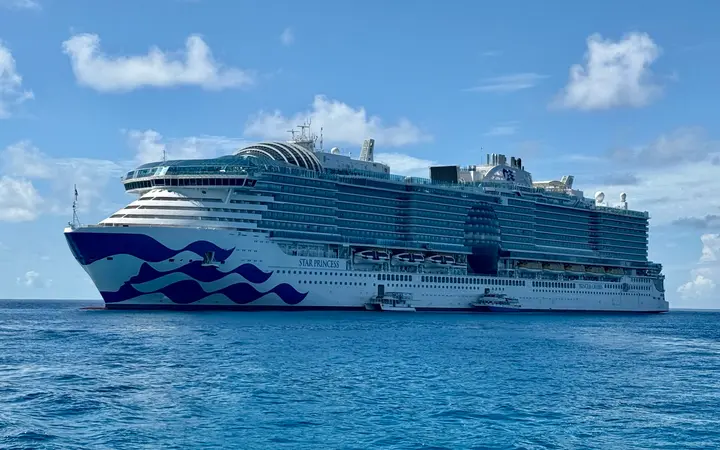
Princess Cruises
Cruise line · ships, cruises and homeports
Princess Cruises sails 17 ships from 35 homeports to 300 ports. Most cruises are 6–8 nights, mostly in the Alaska.

- ShipsShips in service
- 17
- CruisesCruises · 12 mo
- 647
- Homeports
- 35
- PortsPorts visited
- 300
- next 12 months
- Avg ship ageAverage ship age
- 15 yrs
The Princess Cruises fleet
17 ships in service
| Photo | Ship | Built | Gross tonnage | Decks | Cabins | Guests | Crew |
|---|---|---|---|---|---|---|---|
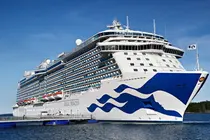
| Star Princess Sphere class · 2025 · 177,882 GT | 2025 | 177,882 | 21 | 2,157 | 4,300 | 1,600 | |
| Sun Princess Sphere class · 2024 · 177,882 GT | 2024 | 177,882 | 21 | 2,157 | 4,300 | 1,600 | |
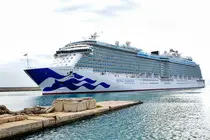
| Discovery Princess Royal class · 2022 · 145,281 GT | 2022 | 145,281 | 19 | 1,830 | 3,660 | 1,346 | |
| Enchanted Princess Royal class · 2020 · 145,281 GT | 2020 | 145,281 | 19 | 1,830 | 3,660 | 1,346 | |
| Sky Princess Royal class · 2019 · 145,281 GT | 2019 | 145,281 | 19 | 1,830 | 3,660 | 1,346 | |
| Majestic Princess Royal class · 2017 · 144,216 GT | 2017 | 144,216 | 19 | 1,780 | 3,560 | 1,346 | |
| Regal Princess Royal class · 2014 · 142,714 GT | 2014 | 142,714 | 19 | 1,780 | 3,560 | 1,346 | |
| Royal Princess Royal class · 2013 · 142,714 GT | 2013 | 142,714 | 19 | 1,780 | 3,560 | 1,346 | |
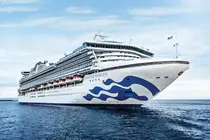
| Diamond Princess Grand class · 2004 · 115,906 GT | 2004 | 115,906 | 18 | 1,353 | 2,710 | 1,100 | |
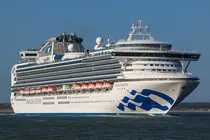
| Sapphire Princess Grand class · 2004 · 115,875 GT | 2004 | 115,875 | 18 | 1,337 | 2,680 | 1,100 |



Where Princess Cruises sails
Ships starting a cruise in each region, by month · Nov 2026 – Oct 2027
Most of the fleet sails in the Alaska: 8 ships at its busiest in May and 1 in Oct. Princess Cruises also sails in Bahamas, Caribbean, Bermuda, Hawaii, Mexico, Panama Canal and Asia, and 7 more regions.
| Region | Nov | Dec | Jan | Feb | Mar | Apr | May | Jun | Jul | Aug | Sep | Oct |
|---|---|---|---|---|---|---|---|---|---|---|---|---|
| Alaska | 5 | 8 | 8 | 8 | 8 | 8 | 1 | |||||
| Bahamas, Caribbean, Bermuda | 7 | 8 | 7 | 7 | 7 | 3 | 2 | |||||
| Hawaii, Mexico, Panama Canal | 3 | 5 | 5 | 4 | 3 | 6 | 5 | 6 | ||||
| Asia | 2 | 2 | 2 | 2 | 3 | 3 | 2 | 3 | 3 | 3 | 2 | 1 |
| Mediterranean | 1 | 2 | 3 | 2 | 2 | 3 | 3 | 3 | 2 | |||
| Australia, New Zealand and Pacific Ocean | 2 | 2 | 3 | 3 | 3 | 1 | 1 | 1 | 2 | 3 | ||
| Baltic, Norwegian Fjords, Russia | 1 | 1 | 3 | 3 | 4 | 4 | 2 | 2 | 1 | |||
| West Coast USA and Canada | 2 | 1 | 5 | 3 | 2 | 3 | ||||||
| Ireland, United Kingdom | 1 | 1 | 1 | 2 | 1 | 1 | 1 | 1 | ||||
| East Coast USA | 1 | 2 | 2 | |||||||||
| Western Europe, Azores, Canary Islands | 1 | 1 | 2 |
Ships in region:1–23–56–1516+
A ship counts in a region when a cruise starting that month has most of its port calls there.
How long Princess Cruises cruises are
Share of sailings by length, against other cruise lines in the same region and month · Nov 2026 – Oct 2027
Across all regions, 42% of Princess Cruises sailings are 6–8 nights, against 49% for other cruise lines.
Princess Cruises
647 sailings
Other cruise lines
15,898 sailings
Up to 5 nights6–8 nights9–13 nights14+ nights
| Length | Princess Cruises | Other lines | Difference |
|---|---|---|---|
| Up to 5 nights | 3% · 21 | 23% · 3,646 | −20 pts |
| 6–8 nights | 42% · 271 | 49% · 7,853 | −8 pts |
| 9–13 nights | 20% · 132 | 16% · 2,519 | +5 pts |
| 14+ nights | 34% · 223 | 12% · 1,880 | +23 pts |
Sailings starting in the period. A voyage sold from several embarkation ports is counted once. Region = where most of the sailing’s port calls are. Difference in percentage points.
Princess Cruises capacity
Available passenger cruise days (APCD): lower berths × nights · Nov 2026 – Oct 2027
- APCD · 12 months
- 24.5M
- Share of all capacity
- 7.3%
- of 336.2M APCD on 45 lines
- Rank by capacity
- 5th
- ahead of Norwegian Cruise Line 21.5M, AIDA Cruises 17.4M
- Berths at sea per day
- 69,245
- average
By month
APCD per month · share of all cruise capacity that month below · Nov counts from 12 Nov
Busiest monthOther months
By region
Princess Cruises APCD and its share of all cruise capacity in each region · top 8 regions
| Region | By month | APCD | Share of region |
|---|---|---|---|
| Bahamas, Caribbean, Bermuda 4.3% of the region | 4.69M | 4.3% | |
| Alaska 27.9% of the region | 4.09M | 27.9% | |
| Mediterranean 3.3% of the region | 3.51M | 3.3% | |
| Asia 21.8% of the region | 3.28M | 21.8% | |
| Hawaii, Mexico, Panama Canal 23.0% of the region | 2.72M | 23.0% | |
| Baltic, Norwegian Fjords, Russia 7.8% of the region | 2.07M | 7.8% | |
| Australia, New Zealand and Pacific Ocean 18.9% of the region | 1.97M | 18.9% | |
| Ireland, United Kingdom 14.9% of the region | 0.66M | 14.9% |
Berths = guests at double occupancy. Each ship-night is counted once, even when the voyage is sold from several ports, in the month it falls in. A sailing’s nights count in the region where most of its port calls are. All capacity = the cruise lines CruiseDig tracks, not the whole industry.
Where Princess Cruises cruises start
Top 10 of 35 homeports by departures in the next 12 months
| Homeport | Departures | Ships | Plan your departure |
|---|---|---|---|
| Fort Lauderdale United States · 9 ships | 106 | 9 | ParkingHotelsGetting there |
| Los Angeles United States · 9 ships | 70 | 9 | ParkingHotelsGetting there |
| Vancouver Canada · 7 ships | 69 | 7 | ParkingHotelsGetting there |
| Southampton United Kingdom · 3 ships | 46 | 3 | ParkingHotelsGetting there |
| Seattle United States · 2 ships | 41 | 2 | ParkingHotelsGetting there |
| Whittier United States · 4 ships | 35 | 4 | ParkingHotelsGetting there |
| San Francisco United States · 1 ship | 30 | 1 | ParkingHotelsGetting there |
| Sydney Australia · 4 ships | 26 | 4 | ParkingHotelsGetting there |
| Tokyo Japan · 3 ships | 23 | 3 | ParkingHotelsGetting there |
| Yokohama (Tokyo) Japan · 1 ship | 23 | 1 | ParkingHotelsGetting there |
Top ports of call
Calls in the next 12 months · 296 ports
- 1KetchikanUnited States166
- 2JuneauUnited States165
- 3SkagwayUnited States143
- 4Amber CoveDominican Republic69
- 5Celebration KeyBahamas68
- 6San JuanPuerto Rico66
- 7Grand TurkTurks and Caicos Islands64
- 8VictoriaCanada60
- 9PhilipsburgSint Maarten51
- 10NagasakiJapan50
- 11BusanSouth Korea49
- 12KochiJapan47