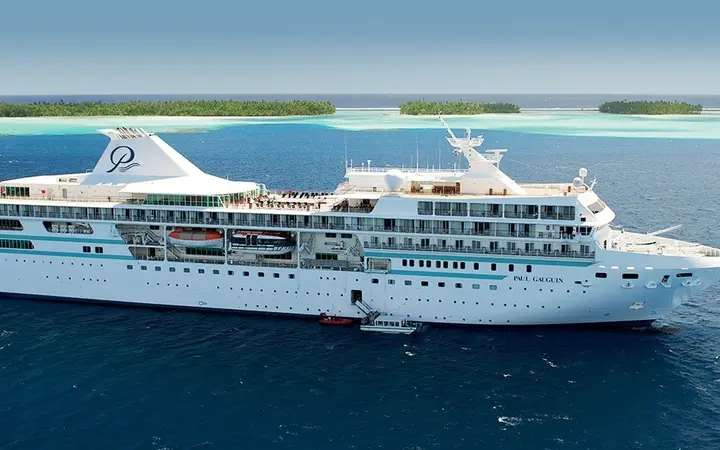
Paul Gauguin Cruises
Cruise line · ships, cruises and homeports
Paul Gauguin Cruises sails 1 ship from 4 homeports to 34 ports. Most cruises are 6–8 nights, mostly in the Australia, New Zealand and Pacific Ocean.
- ShipsShips in service
- 1
- CruisesCruises · 12 mo
- 32
- Homeports
- 4
- PortsPorts visited
- 34
- next 12 months
- Avg ship ageAverage ship age
- 29 yrs
The Paul Gauguin Cruises fleet
1 ship in service
| Photo | Ship | Built | Gross tonnage | Decks | Cabins | Guests | Crew |
|---|---|---|---|---|---|---|---|
| Paul Gauguin 1997 · 19,170 GT | 1997 | 19,170 | 7 | 160 | 320 | 217 |
Where Paul Gauguin Cruises sails
Ships starting a cruise in each region, by month · Nov 2026 – Oct 2027
Most of the fleet sails in the Australia, New Zealand and Pacific Ocean, 1 ship a month. Paul Gauguin Cruises also sails in Asia.
| Region | Nov | Dec | Jan | Feb | Mar | Apr | May | Jun | Jul | Aug | Sep | Oct |
|---|---|---|---|---|---|---|---|---|---|---|---|---|
| Australia, New Zealand and Pacific Ocean | 1 | 1 | 1 | 1 | 1 | 1 | 1 | 1 | 1 | 1 | 1 | |
| Asia | 1 |
Ships in region:1–23–56–1516+
A ship counts in a region when a cruise starting that month has most of its port calls there.
How long Paul Gauguin Cruises cruises are
Share of sailings by length, against other cruise lines in the same region and month · Nov 2026 – Oct 2027
Across all regions, 41% of Paul Gauguin Cruises sailings are 6–8 nights, against 49% for other cruise lines.
Paul Gauguin Cruises
32 sailings
Other cruise lines
16,513 sailings
Up to 5 nights6–8 nights9–13 nights14+ nights
| Length | Paul Gauguin Cruises | Other lines | Difference |
|---|---|---|---|
| Up to 5 nights | 0% · 0 | 22% · 3,667 | −22 pts |
| 6–8 nights | 41% · 13 | 49% · 8,111 | −8 pts |
| 9–13 nights | 41% · 13 | 16% · 2,638 | +25 pts |
| 14+ nights | 19% · 6 | 13% · 2,097 | +6 pts |
Sailings starting in the period. A voyage sold from several embarkation ports is counted once. Region = where most of the sailing’s port calls are. Difference in percentage points.
Paul Gauguin Cruises capacity
Available passenger cruise days (APCD): lower berths × nights · Nov 2026 – Oct 2027
- APCD · 12 months
- 0.10M
- Share of all capacity
- 0.0%
- of 336.2M APCD on 45 lines
- Rank by capacity
- 40th
- ahead of Aurora Expeditions 0.08M, Mano Maritime 0.08M
- Berths at sea per day
- 270
- average
By month
APCD per month · share of all cruise capacity that month below · Nov counts from 12 Nov
Busiest monthOther months
By region
Paul Gauguin Cruises APCD and its share of all cruise capacity in each region · top 2 regions
| Region | By month | APCD | Share of region |
|---|---|---|---|
| Australia, New Zealand and Pacific Ocean 0.9% of the region | 0.09M | 0.9% | |
| Asia 0.0% of the region | 0.00M | 0.0% |
Berths = guests at double occupancy. Each ship-night is counted once, even when the voyage is sold from several ports, in the month it falls in. A sailing’s nights count in the region where most of its port calls are. All capacity = the cruise lines CruiseDig tracks, not the whole industry.
Where Paul Gauguin Cruises cruises start
Top 4 of 4 homeports by departures in the next 12 months
| Homeport | Departures | Ships | Plan your departure |
|---|---|---|---|
| Papeete French Polynesia · 1 ship | 28 | 1 | ParkingHotelsGetting there |
| Lautoka Fiji · 1 ship | 2 | 1 | ParkingHotelsGetting there |
| Darwin Australia · 1 ship | 1 | 1 | ParkingHotelsGetting there |
| Singapore Singapore · 1 ship | 1 | 1 | ParkingHotelsGetting there |
Top ports of call
Calls in the next 12 months · 31 ports
- 1Bora BoraFrench Polynesia29
- 2Tahaa IslandFrench Polynesia29
- 3Moorea IslandFrench Polynesia28
- 4Huahine IslandFrench Polynesia27
- 5Fakarava Atoll TuamotusFrench Polynesia12
- 6Raiatea IslandFrench Polynesia12
- 7Rangiroa Atoll TuamotusFrench Polynesia12
- 8AitutakiCook Islands4
- 9Fatu Hiva IslandFrench Polynesia4
- 10Hiva Oa IslandFrench Polynesia4
- 11Nuku Hiva IslandFrench Polynesia4
- 12AlotauPapua New Guinea2